
STATISTICAL APPLICATIONS FOR PATIENT ORIENTED PRIMARY HEALTHCARE RESEARCH
Goodness of Fit Test
The chi-square goodness of fit test can be used to evaluate data at all variable levels, but because the currency of this test is count data, the goodness of fit test can be used to compute “nominal” and “ ordinal”data.
The chi-square test evaluates data in the form of counts or “frequencies”, as in the “number of” responses within a given category, or the “ number of” people who responded a given way to a specific question, or the number of cases across outcome categories.
In an unbiased research study, we should expect that all possible responses are equally as likely to occur. We call this the unbiased null hypothesis, and state this in terms of frequencies of responses as follows:
H0: f1 = f2 = f3 = f4 = f5
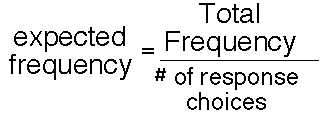
Therefore, based on the null hypothesis, considering that each response category should have an equal number of responses, the formula to computer the expected resonses might be as follows:
The equation below is the basic equation for the chi square goodness of fit test.
 The equation measures how closely an observed set of responses (the “
o” for “observed”) matches an expected set of
responses (the “e” for “expected”).
The equation measures how closely an observed set of responses (the “
o” for “observed”) matches an expected set of
responses (the “e” for “expected”).
The equation below is the basic equation for the chi square goodness of fit test.
The equation measures how closely an observed set of responses (the “o” for “observed”) matches the expected set of responses (the “e” for “expected”).
The important value from this Webulator is the chi-square score. The chi-square score is the sum of (observed- expected)2 ÷ expected.
The computed score is referred to as the chi-square observed. After computing the chi-square observed value, determine the chi-square critical score from a table of chi square values. The chi-square critical score represents what we should expect to observe for a distribution with five responses. The critical value is determined by computing the “degrees of freedom” for our response set.
The computation of the degrees of freedom is:
degrees of freedom = “k” possible responses -1
degrees of freedom = 5-1
degrees of freedom = 4
and the “chi-square critical value” for degrees of freedom of “4”
at p<0.05 = 9.49
 Click here to return to the Webulator Menu Page
Professor William J. Montelpare, Ph.D.,
Margaret and Wallace McCain Chair in Human Development and Health,
Department of Applied Human Sciences, Faculty of Science,
Health Sciences Building, University of Prince Edward Island,
550 Charlottetown, PE, Canada, C1A 4P3
(o) 902 620 5186
Visiting Professor, School of Healthcare, University of Leeds,
Leeds, UK, LS2 9JT
e-mail wmontelpare@upei.ca
Copyright © 2002--ongoing [University of Prince Edward Island]. All rights reserved.