STATISTICAL APPLICATIONS FOR PATIENT ORIENTED PRIMARY HEALTHCARE RESEARCH
In Quantitative Methods we are interested in the spatial
relationship between responses within a set of numbers.
In Quantitative Methods we measure the distance between any individual's score from the estimated mean (average score as a measure of central tendency), as demonstrated in the following example.

The term variability is used to describe the differences between observed scores and measures of central tendency within a distribution of scores.
Given that several scores are used to comprise the set of data for a distribution, in Quantitative Methods we
compute the average distance between the individual scores
and the estimated mean.
This term is referred to as variance.
However, although we can conceptualize variance
as an average score, this average score is not simply
calculated by summing the difference scores and dividing by the number of scores.
Rather, the variance score can be calculated for a "population" and/or for a "sample", where the
terms in the denominators of the two calculations differ.
The formula to compute variance for a population is
shown in Figure 4.2 below:
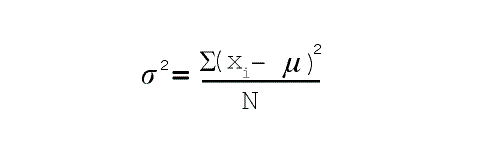
Figure 4.2 Formula to compute variance for a population
The formula to compute variance for a sample is
shown in Figure 4.3 below:
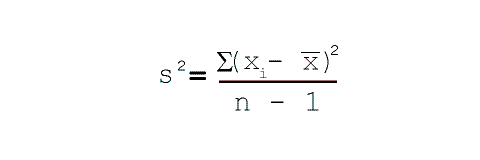
Figure 4.3 Formula to compute variance for a sample
In a general sense, variance is computed by:
- subtracting each
observation from the average score,
- squaring the difference,
- summing the squares and then
- dividing by the number of observations (or the number of observations minus one).
The term variance can best be described as the average of the squared deviations of observations from the mean.

Standard deviation
The term deviation refers to difference.
The term standard deviation refers to the "standardized estimate of variance".
The standard deviation presents the variance in the original units of measurement.
The standard deviation is derived from the estimate of variance, and is computed by simply
taking the square root of the variance (Figure 4.4 below).
The formulae to compute standard deviation for the population and the sample are are
shown in Figure 4.4 below:
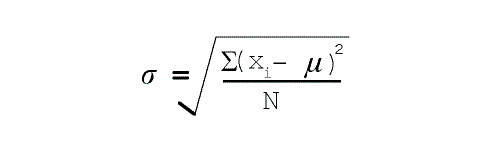
Figure 4.4 (i) Formula to compute standard deviation for a population
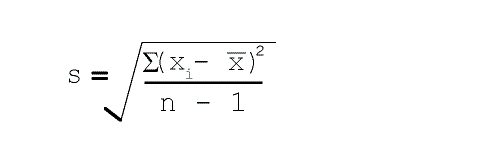
Figure 4.4 (ii) Formula to compute standard deviation for a sample

In Quantitative Methods we often consider the spreads of distributions and the shape of
distributions. Estimates of difference between an individual's score and the measure of
central tendency, the shape of the distribution, and the size of the distribution, are all elements of
VARIANCE
Skewness
Skewness is an estimate of variability. Skewness is considered the "third moment" of scores within a
distribution.
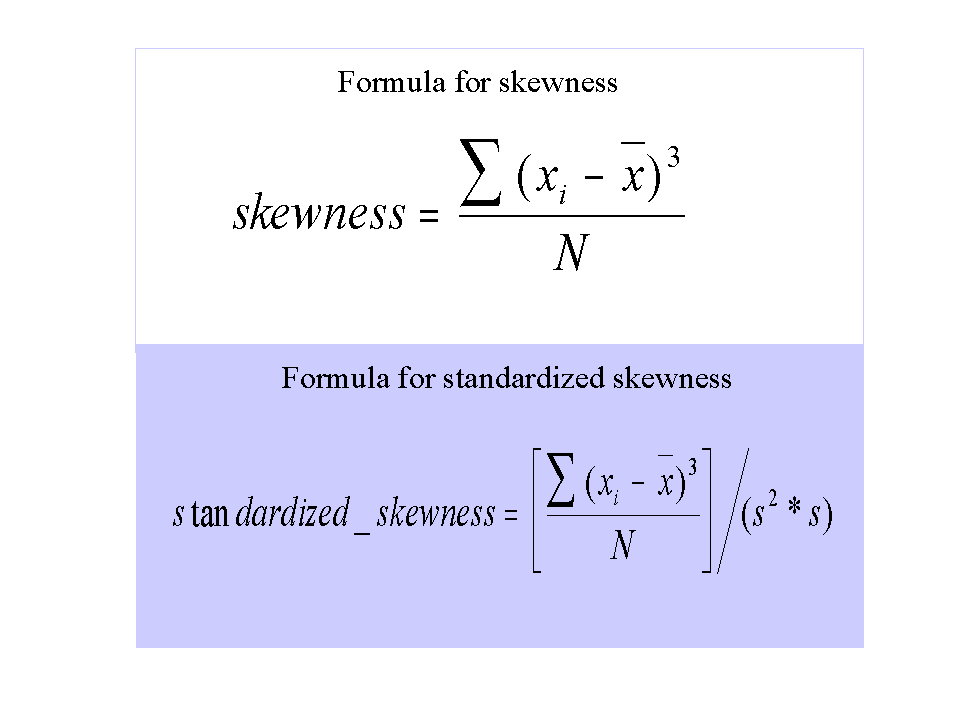
This is easily recognized by the formula for skewness shown in Figure 4.5 below.

Figure 4.5 Formula to compute Skewness
- subtracting each
observation from the average score,
- raising the difference to the exponent "3",
- summing the cubes and then
- dividing by the number of observations (or the number of observations minus one).
A negative skewness score indicates a negatively skewed distribution, while a positive skewness score indicates a positively skewed distribution. Examples of skewed distributions are shown in Figures 4.6, 4.7 and 4.8 below.
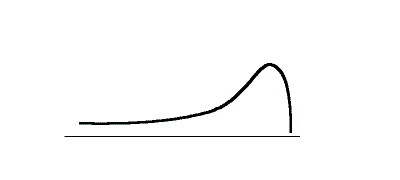
Figure 4.6 Illustration of negative skewness
Notice the tailing off of the distribution toward negative infinity
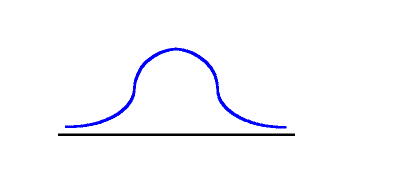
Figure 4.7 Illustration of a normal distribution (no skewness)
Notice the symmetry of the distribution, there is no tailing-off toward either negative or positive infinity
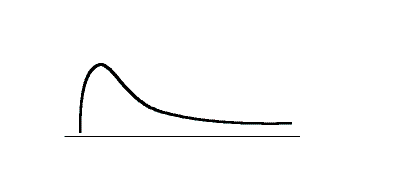
Figure 4.8 Illustration of positive skewness
Notice the tailing off of the distribution toward positive infinity
In most applications, the raw skewness is not used. Rather the reader is directed to the "standardized skewness" as shown in the formula below.

Kurtosis
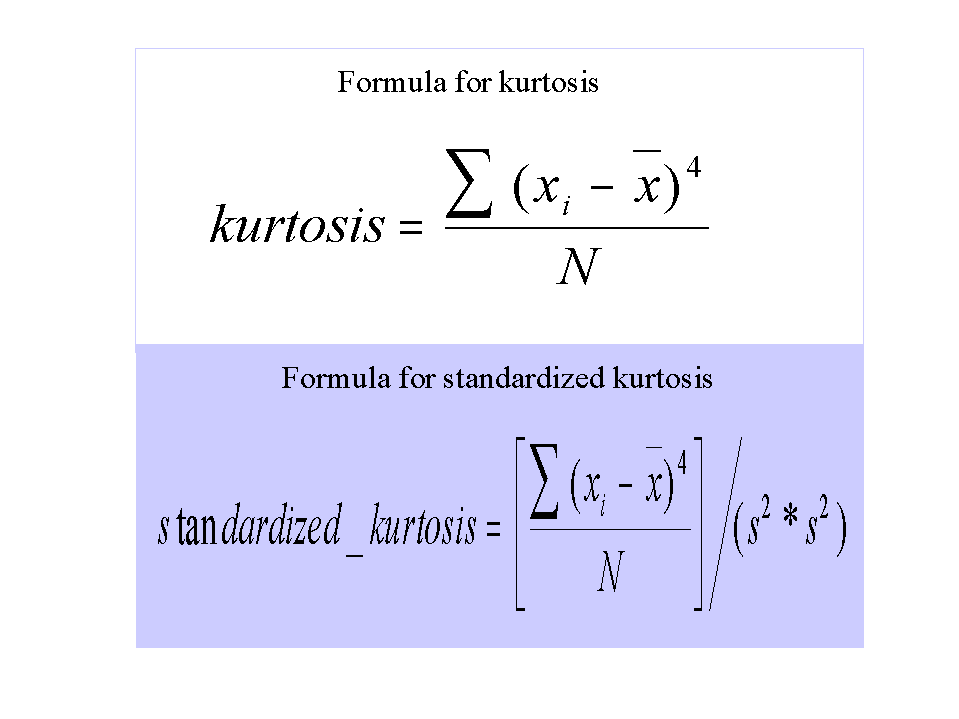
Kurtosis is also an estimate of variability. Kurtosis is considered the "fourth moment" of scores within a
distribution. Again, this is easily recognized by the formula for kurtosis shown in Figure 4.9 below. Notice that similar to estimates of
variance and skewness, the estimate of kurtosisis a pseudo-average difference score.
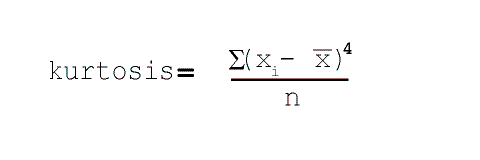
Figure 4.9 Formula to compute kurtosis
- subtracting each
observation from the average score,
- raising the difference to the exponent "4",
- summing the products and then
- dividing by the number of observations (or the number of observations minus one).
Examples of kurtosis are shown in
Figures 4.10, 4.11 and 4.12 below.
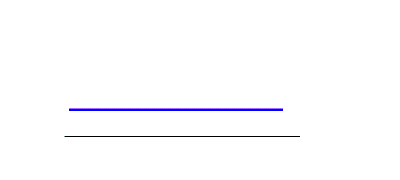
Figure 4.10 Illustration of a platykurtic distribution
Notice the flatness of the distribution (remember the term platy refers to flat). In order to achieve a platykurtic distribution, all scores within the distribution are unique.

Figure 4.11 Illustration of a mesokurtic distribution
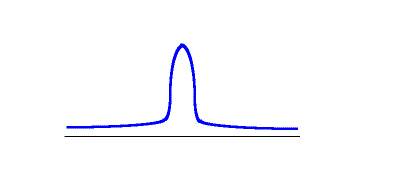
Figure 4.12 Illustration of a leptokurtic distribution
Notice the Peakedness of the distribution (remember the term lepto refers to leaping). In order to achieve a leptokurtic distribution, all scores within the distribution are located close to the mean. There is very little deviation of scores from the measure of central tendency within the distribution.
In most applications, the raw kurotsis is not used. Rather the reader is directed to the "standardized kurtosis" as shown in the formula below.
 Click here to return to the Webulator Menu Page
Professor William J. Montelpare, Ph.D.,
Margaret and Wallace McCain Chair in Human Development and Health,
Department of Applied Human Sciences, Faculty of Science,
Health Sciences Building, University of Prince Edward Island,
550 Charlottetown, PE, Canada, C1A 4P3
(o) 902 620 5186
Visiting Professor, School of Healthcare, University of Leeds,
Leeds, UK, LS2 9JT
e-mail wmontelpare@upei.ca
Copyright © 2002--ongoing [University of Prince Edward Island]. All rights reserved.
